13 March 2008
Japan Agency for Marine-Earth Science and Technology
Hokkaido University
GULF STREAMS INFLUENCE TO THE TROPOSPHERE
HAS BEEN REVEALVED
1.Abstract
An international team, to which Dr. Akira Kuwano-Yoshida and Dr. Nobumasa Komori of Computational Earth Science Research Program, Earth Simulator Center, the Japan Agency for Marine-Earth Science and Technology (JAMSTEC: Yasuhiro Kato, President) participate (member: Prof. Shoshiro Minobe (lead author, Hokkaido University (Hiroshi Saeki, President)), Dr. Akira Kuwano-Yoshida, Dr. Nobumasa Komori, Prof. Shang-Ping Xie (International Pacific Research Center (IPRC), University of Hawaii), and Dr. Justin Small (IPRC)) has revealed that the Gulf Stream influences air temperature, precipitation and winds in the troposphere. Their finding indicates that the Gulf Stream influences from the atmospheric boundary layer (*1) to the upper troposphere by releasing heats brought by the current from low-latitudes. This study makes a huge progress on how the Earths climate is formed, and will substantial impacts on studies of feedback from major ocean currents, such as the Gulf Stream and Kuroshio. This study will be published on the issue of March 13, 2008 of Nature as the cover article.
2.Background
The Gulf Stream is the strongest oceanic current in the Northern Hemisphere followed by the Kuroshio. A reason why the Europe is warmer than North America has been attributed to the Gulf Stream. The influence of the Gulf Stream to the atmosphere is known for geneses of cyclones and formation of clouds for weather phenomena whose timescales are several days. Climatic influences of the Gulf Stream on longer timescales than a month were not clarified. This is because observational data and numerical simulations that have long (several years) available period with high spatial resolutions were not available until recently.
3.Method
The team has exploited recent satellite datasets, high-resolution weather analyses, and numerical simulation on the Earth Simulator. These datasets and numerical model outputs have 0.25-1 degree resolution, which is much higher than the typical resolution of climate studies (2.0-2.5 degree). The high spatial resolution allows unveiling the atmospheric influences of the Gulf Stream, which were not reported previous studies.
4.Results
The findings described below indicate that the vast heat release from the Gulf Stream is the key for the atmospheric influence from the surface to the upper troposphere.
(1) Convergence/Divergence of surface winds via pressure adjustments
The mechanism responsible why surface winds converge over the Gulf Stream and diverge onshore side of the Gulf Stream is identified (Fig. 1ab). The team founds the distribution of the surface wind convergence and divergence well correspond to curvature of sea-level pressures (*2) (Fig. 1c). This means that warmed air over the Gulf Stream is relatively light and thus resultant sea-level pressure becomes relatively low. The air in near shore region is not strongly warmed, and thus associated with relatively high pressures at the surface. The relative pressure difference pushes air from the high pressure to low pressure, resulting in divergence and convergence, respectively.
(2) Narrow rain band
Occurrence of narrow rain band meandering with the Gulf Stream is revealed from analysis of satellite precipitation data (Fig. 2a). This feature is also brought by the heat release from the Gulf Stream. Most of the heat release from the Gulf Stream is due to evaporation, and resultant moisture condenses into water particle in the atmosphere at height, with heating nearby air-masses.
The precipitation distribution is successfully reproduced by the Atmospheric general circulation model For the Earth Simulator (AFES) (*3) (Fig. 2b). For this rain band, steep gradients of sea-surface temperatures are necessary; the rain band disappears, when the gradients of the surface temperatures are smoothed (Fig. 2c). It is also shown that the steep gradients concentrate distribution of cyclones along the temperature gradient (Fig. 3). These results clearly show that the Gulf Stream play an important role in distribution of precipitation and cyclones.
(3) Influence to the upper troposphere
The aforementioned atmospheric heating implies that the influence of the Gulf Stream is not limited to near surface (up to 1 km from the surface) Marine Atmospheric Boundary Layer, but penetrate further aloft. Actually, it is found that upward air motions occurring over the Gulf Stream penetrate to the upper troposphere (Fig. 4a). Furthermore, high frequency occurrences of high clouds are revealed by an analysis of satellite-derived out-going longwave radiation (Fig. 4c).
The upward motion reaching to the upper troposphere is closely related to horizontal divergence there (Fig. 4b), which is important in generating planetary waves (known also as Rossby waves). The planetary wave is the major agent for remote response in the Earths atmosphere. A linearized atmospheric model experiment indicates that planetary waves generated from the atmospheric heating due to the Gulf Stream propagate to the east down to the Europe and farther (Fig. 5).
5.Future prospective
As a summary, the present study revealed that the Gulf Stream causes systematic atmospheric responses from the surface to the upper troposphere (Fig. 6). This finding may lead a new perspective for mid-latitude air-sea interaction. For example, a major question for the abrupt climate change found in paleoclimate data is how oceanic changes can influence the atmosphere. The present study suggests a pathway from the Gulf Stream to the atmosphere. Furthermore, in future climate change, the strength of the Atlantic meridional overturning circulation, whose upper limb includes the Gulf Stream, is expected to become weak, as described in the fourth report of IPCC in the last year. The weakening of the circulation may influence the Gulf Stream, which in turn has impacts for local and possibly remote climate.
The oceanic current examined in the present study is the Gulf Stream, but similar processes may occur for air-sea interaction in other regions. The present findings suggest that the Kuroshio, which provides similar magnitude of heat to the atmosphere, may also have substantial impact on the atmosphere. A preliminary study suggest, however, the atmospheric influence of the Kuroshio is likely to be more complex than that of the Gulf Stream, and thus further studies for the Kuroshio and its extension is necessary. In near future, exploiting findings obtained in the present study, the ocean-to-atmospheric feedback from the Kuroshio and other currents will also be investigated.
* The present study is supported by grant-in-aid for scientific research (kaken-hi) and by 21st century center of excellence program on Neo-Science of Natural History, both from the Ministry of Education, Culture, Sports, Science and Technology, Japan.
- *1
- Atmospheric boundary layer: A layer of air from the surface to several hundreds meters or 2 km, in which the air is directly influenced by surface conditions. Mean heights of the atmospheric boundary layer is several hundred meters to 1 km. The atmosphere above the boundary layer is sometimes called free atmosphere.
- *2
- The curvature is calculated as the second derivative or Laplacian.
- *3
- Atmospheric general circulation model: A computer program to calculate time evolutions of global atmospheric flow, temperature, and humidity based on equations of fluid dynamics and thermodynamics. AFES (Atmospheric general circulation model For the Earth Simulator) has been mainly developed by Atmosphere and Ocean Simulation Research Group, Earth Simulator Center with the efforts of Frontier Research Center for Global Change, and can fast compute high-resolution atmospheric global circulation on the Earth Simulator. In present study, 50 km horizontal resolution is used.
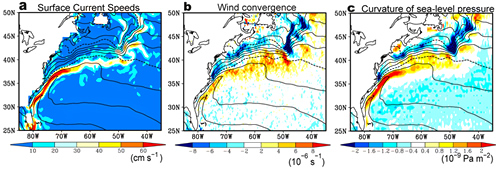
Figure 1. Annual climatology of surface parameters. Color indicates (a) surface geostrophic oceanic current speed, (b) satellite observed 10-m wind convergence, (c) curvature of sea-level pressures in operational weather analysis. Contours are sea-surface temperature (2°C interval and dashed contours for 10°C and 20°C).
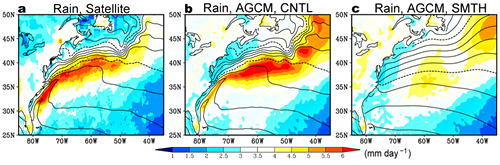
Figure 2. Annual climatology of rain rate: (a) observed by satellites, and in the atmospheric general circulation model with (b) observed and (c) smoothed sea-surface temperatures. Contours are for sea-surface temperature as in Fig. 1.
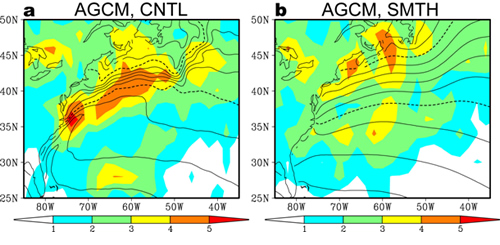
Figure 3. Annual mean climatology of cyclone number density (color) simulated by the Atmospheric General Circulation Model (AGCM) using observed (a) and smoothed (b) sea-surface temperatures (contours). A cyclone is detected as the sea-level pressure minimum with a radius larger than 300 km on 6-hourly maps. The units of the color bar are number per year in a bin of 2.0°×2.0°C, and contour interval is 2°C with the 10°C and 20°C contours dashed.
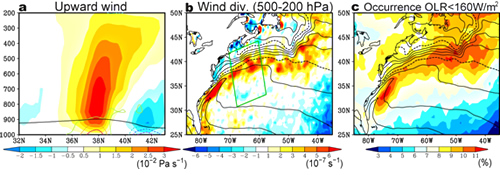
Figure 4. Annual climatology of parameters connecting atmospheric boundary layer and free atmosphere (a) vertical wind velocity (upward positive; color), boundary layer height (black curve), and wind convergence (color contours for ±1, 2, 3×10⁻⁶ s-1) averaged in the along-front direction in the green box in panel (b), based on the weather analysis of European Centre for Medium-Range Weather Forecasts; (b) upper-tropospheric wind divergence averaged between 200 and 500 hPa; (c) occurrence frequency of daytime satellite-derived out-going longwave radiation smaller than 160 W m-2 (color). Contours in panels (b) and (c) are for sea-surface temperature as in Fig.1.
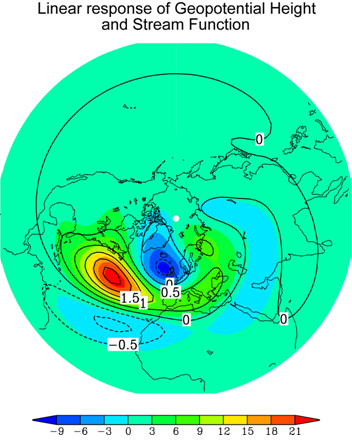
Figure 5. Atmospheric response expressed by geopotential height (color in m) and stream function (contour in 106 m2 s-1) at 250 hPa in the Linear Baroclinic Model to the heating from the Gulf Stream. The atmospheric response to the Gulf Stream heating features positive height anomalies over the mid-latitude North Atlantic and negative anomalies to the north and south, contributing significantly to the westerly jet from North America to Europe.
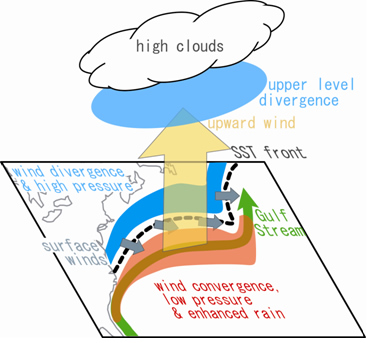
Figure 6. Summary of the climatic responses to the Gulf Stream. On the offshore flank of the Sea-Surface Temperature (SST) front (black dashed curve) of the Gulf Stream (green long arrow), surface wind convergence associated with low pressure (positive sea-level pressure Laplacian), and enhanced rain occur (red shade). On the onshore flank of the front, surface wind divergence associated with high pressure (negative sea-level pressure Laplacian) occurs (blue shade). The distribution of the wind convergence and divergence is closely associated with surface winds across the sea-surface temperature front (short gray arrows). Anchored by the wind convergence and enhanced precipitation, upward motion penetrates into the upper troposphere (yellow arrow). The upward wind velocity is associated with the upper-level horizontal divergence (blue oval) and frequent occurrence of high-level clouds.
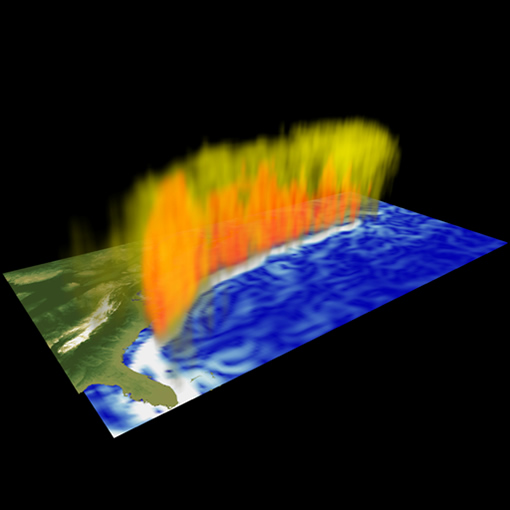
Fig. 7.Annual mean upward wind speeds (red and yellow, red is faster) over the surface geostrophic oceanic currents (blue and white, white is faster). This image was produced by Dr. Fumiaki Araki and Dr. Shintaro Kawahara, Advanced Perception Research Group, Earth Simulator Center, JAMSTEC.
Contacts:
- (For the study)
- Akira Kuwano-Yoshida, Scientist
- Atmosphere and Ocean Simulation Research Group,
Computational Earth Science Research Program,
Earth Simulator Center (ESC),
The Japan Agency for Marine-Earth Science and Technology - Shoshiro Minobe, Professor
- Graduate School of Science, Hokkaido University
- (For publicity)
- Shinji Oshima, e-mail: press@jamstec.go.jp
- Manager, Planning Department Press Office
The Japan Agency for Marine-Earth Science and Technology - Mr. Tsuyoshi Sanbongi
- Administration Division, Hokkaido University