May 25, 2010
Japan Agency for Marine-Earth Science and Technology
High-Resolution Seafloor Mapping Reveals Marine Landslide Triggered by 2009 Suruga Bay Earthquake
Overview
The Earthquake and Tsunami Research Project for Disaster Prevention, Japan Agency for Marine-Earth Science and Technology (JAMSTEC), have found geologic evidence of submarine landslide, possibly triggered by a magnitude-6.5 earthquake occurred in the Suruga Bay on August 11th, 2009. The trace of the landslide was recognized in the earthquake source region, by the high-resolution bathymetric survey onboard the Research Vessel(R/V) Natsushima and remotely-controlled autonomous underwater vehicle (AUV) named “Urashima, “ along with underwater visual observation using a 3000m-class remotely operated vehicle “HYPER-DOLPHINE”.
A high-resolution 3D image of the seafloor, created by AUV Urashima, clearly depicted a horse-shoe shaped scarp measuring 450 meters wide and 10 to 15 meters deep approximately 5 kilometers off the coast of Yaizu City, Shizuoka Prefecture. The map also implied the occurrence of turbidity currents along a nearby submarine canyon. The comparison of bathymetric profiles newly obtained from this study with those collected in the past illustrates significant changes in water depth at the source region of the August 2009 earthquake, implying the involvement of the earthquake in the above slope failure and sediment transport.
The signs of submarine landslide also highlight its possible involvement in the damage to a deep-sea water suction pipe laid at a depth of 687 meters below the sea surface in the surveyed area. The pipe was later found to be destroyed following the earthquake.
Submarine landslides often generate unexpected tsunamis and cause damage to seafloor installations such as telecommunication cables. Yet, their dynamic behavior has not been fully understood; thus detailed studies on the submarine landslide identified in this study are expected to improve tsunami predictions and measures against possible damage to submarine cables.
Background
A large earthquake measuring at 6.5 on the Richter scale occurred in the Suruga Bay on August 11, 2009. It was the first earthquake for which the Tokai Earthquake Report (*1), was issued by the government. The earthquake, dubbed as Suruga Bay Earthquake, caused wide-spread destruction including an embankment collapse on Tomei Highway and serious damage to the deep-sea water facility of Shizuoka Prefecture in the Suruga Bay. Since this earthquake event, the supply of deep-sea water has been partially suspended. Tsunami waves were also observed following the earthquake, at a maximum of 62 cm drawback in Yaizu, and a 36 cm surge at Omaezaki, Shizuoka Prefecture.
Following the earthquake, a simulation of tsunami waves was carried out using a fault model based on the crustal deformation data or observed seismic waves. The results however did not reproduce the observed tsunami heights. This implies the possible involvement of other factors in tsunami generation, especially submarine landslides
The Suruga Bay Earthquake occurred in the expected source region of a possible major Tokai Earthquake. The evidence of earthquake-induced landslide in this region would, therefore, pose a potential threat of submarine landslides and subsequent disastrous tsunamis at the time of Tokai Earthquake. Yet, the behavior of submarine landslide is poorly understood, making it difficult to forecast its occurrence. Scientists at JAMSTEC carried out a survey in the source region of the Suruga Bay Earthquake to gain insights into the occurrence of an earthquake-induced landslide and its impacts.
The results will be presented in a poster session at the “Japan Geoscience Union Meeting 2010” in May 27, 2010.
Outline of the surveys (Surveyed area: Fig.1)
December 13th and 14th, 2009
Underwater visual observation in the source region of the Suruga Bay earthquake using the remotely-operated HYPER DOLPHINE
December 26th to 31st, 2009
Bathymetric mapping around the source region, using a multi-beam echo-sounder (*2) onboard R/V Natsushima
February 27th to March 1st, 2010
Bathymetric mapping of the source region using a multi-beam echo-sounder mounted on AUV Urashima
Results
The multibeam bathymetric data collected from the Natsushima survey was compared with those from 2004 and 2006 surveys. The results show that the seafloor was subsided after the earthquake, about 5 km off the coast of Yaizu City (138°23’ E, 34°52’ N) at a water depth of 600 meters (red-circled area in Fig. 2).
The subsequent high-resolution underwater mapping by AUV Urashima revealed a horseshoe-shaped scarp, geologic evidence indicative of submarine landslides, which measures 450 meters wide and 10 to 15 meters deeper than the surrounding seafloor level (Fig. 3). The map also depicted sand dunes rippled by periodic water flow on the both sides of a gently sloped submarine canyon southeast to the scarp; whereas such ripples are not clear in the canyon on the lower slope, suggesting the influx of turbidity currents from the landslide source area.
In the downstream of the canyon was buried one of the deep-sea water suction pipes owned by Shizuoka Prefecture, at the maximum depth of 687 meters (Fig. 2: green line). Due to earthquake damage to this suction pipe, the supply of deep-sea water has been suspended. The dislodged pipe was later located by HYPER DOLPHINE, laying at approximately 2 km downstream of its original site and aligned along the canyon axis (Fig. 2: blue line). Muddy sediment accumulates more on the southwest side of the pipe, along with surface sediments and a ship wreck seemingly carried by strong flows (Fig. 4). The pipe’s steel-wire armor was also found torn apart. These facts suggest that the turbidity currents caused by the earthquake destroyed the pipe and swept it away further offshore.
Future perspectives
The survey identified a submarine landslide possibly responsible for tsunami waves following the August 2009 quake. In order to better understand the behavior and mechanism of submarine landslides, JAMSTEC scientists plan to develop numerical models to simulate tsunami inception and inundation, conduct close and detailed monitoring of the seafloor, sample and analyze seafloor sediments, and profile the subseafloor structure. The findings are expected to improve the ability to predict tsunami waves induced by offshore earthquakes (e.g. the Tokai Earthquake), and reduce their possible impacts on seabed infrastructure including telecommunication cables.
*1 Tokai Earthquake Report
One of the earthquake warning information related to the occurrence of the possible Tokai earthquake. It is issued by the Japan Meteorological Agency when observed seismic anomalies are not immediately judged as ominous signs of the Tokai Earthquake or they are not directly linked to the Tokai Earthquake.
Warnings are issued based on three levels of risk: (from lower to higher) Tokai Earthquake report, Tokai Earthquake Advisory, and Tokai Earthquake Warning.
*2 Multi-beam echo-sounder
A multi-beam echo-sounder system emits multiple acoustic beams from the bottom of a ship and simultaneously receives their reflections from the seafloor. It allows for real-time measurements of the ocean depth and mapping of the ocean floor with beam width twice the ocean depth.
Figure 1: Bathymetric chart of the surveyed area
Areas surveyed by R/V Natsushima (red rectangle) and by AUV Urashima(blue rectangle). Visual observation using HYPER DOLPHINE was carried out in the green rectangle area.
The black lines denote contour lines with an interval of 100 m. The yellow star shows the epicenter of the Suruga Bay Earthquake on August 11, 2009. The survey results by Natsushima (within the red rectangle) are shown in Figure 2.
Figure2: Bathymetric data collected by R/V Natsushima (within the red rectangle in Fig.1)
(a)Bathymetric map with red counter lines (10-m intervals) and black counter lines (2-m intervals).
(b) Water depth difference between the newly obtained and past data (2004 and 2006). Blue colors denote the subsidence of the seafloor and warm colors denote the uplift. The red contour lines represent the newly obtained topography (10-m intervals). Excluding the data affected by steep terrains and pulse noise associated with the platform motion, larger increases in water depth are observed in the red-circled area. The green line indicates the original location of the deep-sea water suction pipe and the blue line indicates its new position confirmed by HYPER DOLPHINE after the quake.
Figure 3: Seafloor topography created by AUV Urashima
The AUV Urashima can cruise close to the seafloor and map the bathymetric relief at extremely high resolution. The mapping by Urashima reveals a horseshoe-shaped scarp (450 m in width and 10 to 15 m in depth) in the red circled region in Figure 2, which is geologic evidence of a submarine landslide. The high-resolution images by the AUV also depicted dunes rippled by periodic water flow, but such ripples are not as distinctive in the submarine canyon southeast of the scarp as those on its adjacent slopes, suggesting the occurrence of turbidity currents following the landslide.
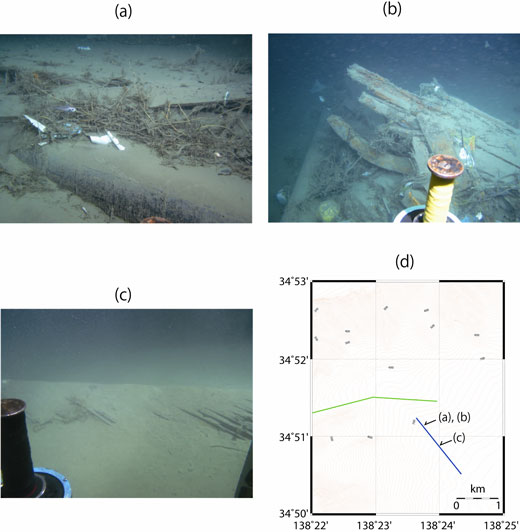
Figure 4: Dislodged suction pipe (steel-wire armored polyethylene pipe; outer diameter of 270mm), photographed by HYPER DOLPHINE
(a) Muddy sediment accumulates more on the southwest side of the pipe; (b) A ship wreck lying on the pipe; (c) Steel-wire armor of the pipe is torn apart; (d) Locations of the photographs (a) to (c). Red contour lines are at 10-m intervals. The original location of the pipe (green) and after the quake (blue).
Contacts:
-
Japan Agency for Marine-Earth Science and Technology
(About the study) - Toshitaka Baba
System Operation and Data Management Group
Earthquake and Tsunami Research Project for Disaster Prevention
- (For publication)
-
Toru Nakamura, Manager
Press Office, Planning Department
E-mail: press@jamstec.go.jp