September 10, 2010
Japan Agency for Marine-Earth Science and Technology
Sea Surface Temperature Found to Have Strong Impacts Upon the Summer Weather in
Japan
~ North-south sifts in the jet stream position bring a hot-cold summer ~
1. Abstract
Mototaka Nakamura, a Senior Scientist at the Japan Agency for Marine Science and Technology, and his colleague diagnosed the atmospheric and oceanic data and discovered that the sea surface temperature in the Sea of Japan and a zonally-elongated area to the east of Japan, centered on the path of the Oyashio Current has strong impacts on the summer atmospheric condition in Japan. They contrived a diagnostic method better suited for analyzing the large-scale atmospheric conditions in the middle and high latitudes and used it to find that the surface temperature over Japan becomes abnormally warm when the sea surface temperature in the aforementioned areas was anomalously high in July and/or August, and vice versa. The anomalous condition persists in the following September as well, though its magnitude declines. They discovered that the sea surface temperature anomalies are likely to be products of air-sea interactions and that the interactions need to be considered carefully to improve the summer seasonal forecasts.
This result is reported in a paper published in the Journal of Climate Early-Online-Release on September 10, 2010, by the American Meteorological Society.
- Title:
- Dominant anomaly patterns in the near-surface baroclinicity and accompanying anomalies in the atmosphere and oceans. Part II:North Pacific basin
- Authors:
- Mototaka Nakamura, and Shozo Yamane
2. Background
Based on the past data diagnoses and simulation studies, the majority of the climate research community had come to conclude that sea surface temperature anomalies in the middle and high latitudes are passive to the atmosphere and do not have strong impact on the large-scale atmospheric conditions. However, the past data diagnoses had not employed methods that are suitable for detecting the oceanic impact on the large-scale middle and high latitude atmosphere whose state is under strong influence from the Earth’s rotation, unlike the atmosphere in the tropics. Also, the simulation studies on this topic did not use numerical models that have high spatial resolutions necessary to accurately reproduce the atmospheric response to the sea surface temperature anomalies along oceanic fronts, such as the Gulf Stream and Kuroshio Current. We thus applied a diagnostic framework that considers the key factors in the dynamics of the large-scale atmosphere in the middle and high latitudes and can possibly connect the atmospheric circulation anomalies to the surface of the oceans.
3. Diagnostic method and data used
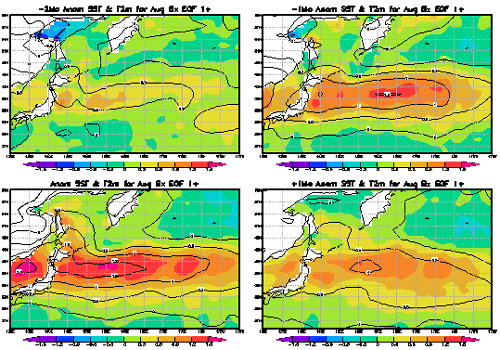
We used baroclinicity, the most important dynamical factor for the middle latitude atmosphere, as the center of our data diagnosis. Baroclinicity can be thought of as the north-south temperature differential or gradient, and is a parameter that indicates the strength of the jet in the upper troposphere and the strength of storm systems. We calculated the baroclinicity near the surface of the atmosphere, using the European Centre for Medium-Range Weather Forecasts 40 Year Re-analysis(ERA-40) and National Centers for Environmental Prediction/National Center for Atmospheric Research (NCEP/NCAR) atmospher ic reanalysis, for each month over the period from September 1957 through August 2002, and extracted the most dominant patterns of its variations by calculating its Empirical Orthogonal Functions (EOFs) for each calendar month. We then examined the principal component of the first two EOFs (the two most dominant variation patterns) and selected years that show anomaly patterns in the near-surface baroclinicity that resemble the patterns found in the EOFs. By averaging anomalies in various fields in the atmosphere and sea surface temperature for each of the EOFs, we formed anomaly composites and, thus, produced pictures of the atmospheric and oceanic anomalies that accompany the dominant anomaly patterns in the near-surface baroclinicity. We also produced anomaly composites for the month preceding and following the month that shows baroclinicity anomalies and examined the temporal development of the anomalies in the atmosphere and oceans, and the roles played by the atmosphere and oceans in the generation of the anomalies. For the sea surface temperature, we used the Hadley Centre data set.
4. Result highlights and discussions
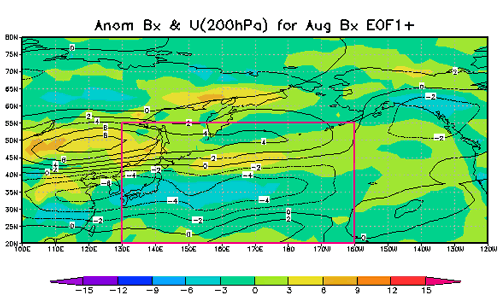
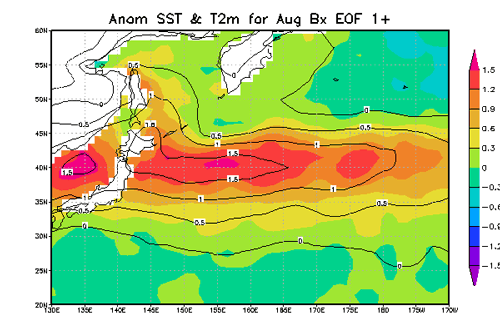
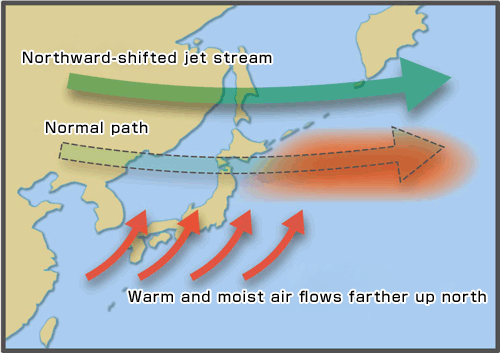
The most interesting case is found for July and August, the months that have been considered to be unimportant as far as the study of air-sea interactions is concerned. The most dominant anomaly pattern of near-surface baroclinicity for July and August indicates a north-south shift in the position of the band of large near-surface baroclinicity along the Oyashio extension, extending eastward from the east coast of the northern Japan over the distance of a few thousands kilometers. Accompanying the north-south shift is a shift in the same sense of the position of the tropospheric jet and storm activity, due to the effect of the “thermal wind” that arises from the horizontal temperature gradient (Fig 1). The shift in the near-surface baroclinicity is found to be caused by anomalies in the sea surface temperature that begin to form in June to the east of the northern Japan (Fig 2). It is also accompanied by sea surface temperature anomalies in the Sea of Japan. Thus, the sea surface temperature anomalies in these areas modify the near-surface baroclinicity in the atmosphere, thereby shifting the paths of the jet stream and storm systems in the north-south direction. When the sea surface is anomalously warm in these areas, the band of large near-surface barocliniicity is shifted northward, allowing warm and moist tropical air masses to enter the northern Japan more readily, and vice versa(Fig 3). The resulting surface temperature anomalies over the Japanese islands range from 0.5 degrees Celsius to 1.5 degrees Celsius, which are large anomalies for the monthly mean temperature (Fig 2).
They examined the heat exchanges between the atmosphere and oceans also and concluded that the sea surface temperature anomalies are most likely products of air-sea interactions, rather than products of anomalous atmospheric forcing alone or oceanic forcing alone.
The atmospheric data analyzed cover up to August 2002. However, summers of 2003, 2004, 2009, and 2010, in which the Japanese islands experienced abnormally cool or hot weathers, all show sea surface temperature anomalies that resemble those shown in Fig 2, suggesting that these recent abnormal summers in Japan were also caused by the abnormal oceanic conditions in the vicinity of Japan.
5. Future plan
Based on these findings, researchers at JAMSTEC plan to carry out simulation experiments, using regional atmospheric simulation models with high spatial resolutions, to see if the atmosphere does indeed respond to the sea surface temperature anomalies like those shown above in a manner reported in this study. Preliminary experiments show promising results. After experiments with the atmospheric simulation model, they plan to carry out simulation experiments with atmosphere-ocean coupled simulation models in a hope to elucidate the mechanisms that can generate the anomalies in the oceans and atmosphere shown here.
Contacts:
- Japan Agency for Marine-Earth Science and Technology
(For the study) - Mototaka Nakamura, Senior Scientist
Climate Variation Informatics Research Team
Climate Variation Predictictability and Applicability Research Program
Research Institute for Global Change
- (For publication)
-
Toru Nakamura, e-mail: press@jamstec.go.jp
Manager, Planning Department Press Office