Press Releases
May 23, 2013
JAMSTEC
University of Hawaii
Discovery of Weakening Trend for Equatorial Quasi-Biennial Oscillation with Global Warming
-New Observational Findings Verify Changes in Global-Scale Circulation-
1. Overview
Senior Scientist Yoshio Kawatani of the Japan Agency for Marine-Earth Science and Technology (JAMSTEC: Asahiko Taira, President) Research Institute for Global Change and Professor Kevin Hamilton of the International Pacific Research Center of the University of Hawaii analyzed 60 years of observational data, and discover the strength of the Equatorial Quasi-Biennial Oscillation (QBO)*1 that exists in the stratosphere (in the approximately 18 to 50 km altitude region) in the equatorial regions has been weakening over the past several decades. Furthermore, they used recent climate model data to show that the weakening QBO is due to the strengthening of the equatorial upwelling at about 19 km altitude. This research is the first to verify with observational data that the stratospheric global-scale circulation*2 strengthens with global warming, as has been predicted by the world's major climate models. The findings have important implications for the future stratospheric ozone recovery*3 and would be a major contribution to the scientific knowledge being collected by the Intergovernmental Panel on Climate Change (IPCC)*4. This work was supported by the Ministry of Education, Culture, Sports, and Science Grant-in-Aid for Young Scientists B (MEXT KAKENHI Grant Number 23740353); Grant-in-Aid for Scientific Research B (KAKENHI Grant Number 24340113); and Ministry of the Environment Research and Technology Development Fund (A1201). The report is scheduled to be published in Nature on May 23 (local time).
*1 The zonal wind in the tropical stratosphere switches between prevailing easterlies and westerlies with a period of about 28 months. See Figure 2.
*2 The circulation, called the Brewer-Dobson circulation, spreads from the equator to the north and south. See Figure 1.
*3 From the World Meteorological Organization (WMO) and the United Nations Environment Programme (UNEP) Scientific Assessment of Ozone Depletion. The assessment reports on the current status and outlook for ozone layer depletion.
*4 Intergovernmental organization composed of international specialists tasked with compiling and synthesizing scientific, technical, and socio-economic knowledge related to climate change. The IPCC received the 2007 Nobel Peace Prize and is currently producing its 5th Assessment Report.
Overview of the Brewer-Dobson Circulation and QBO, the phenomena that form the basis of the research findings
- Brewer-Dobson Circulation (BD Circulation)
Figure 1 shows the global-scale meridional circulations in the stratosphere. The green colored area is the troposphere (from the surface to about 18 km over the equator) where daily weather changes occur. In the stratosphere (from about 18 to 50 km altitude over the equator; blue area), there is a large-scale circulation wherein air rises over the equator, spreads to the northern and southern hemispheres, and descends near 60° North and South latitude, as indicated by the arrows. This large-scale circulation is called the Brewer-Dobson Circulation (BD circulation). This is an extremely important global-scale circulation because it globally transports ozone, water vapor, methane and other aspects of stratospheric chemistry that make a significant contribution to climate change.
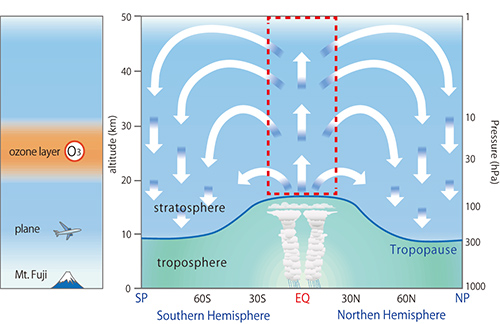
Figure 1. Schematic figure of the meridional large-scale circulation up to an altitude of about 50 km. The green region is the troposphere (from the surface to about 18 km over the equator) and the blue area is the stratosphere (from about 18 to 50 km altitude over the equator). Upwelling occurs at the equator; this air spreads north and south, and then descends at high latitudes. Ozone and other chemical species are transported by this circulation. The dotted red lines show the area where the QBO exists.
- Quasi-Biennial Oscillation
Figure 2a shows the horizontal flows in the equatorial stratosphere. The zonal wind in the tropical stratosphere switches between easterlies and westerlies with a period of about 28 months. This oscillation is called the Quasi-Biennial Oscillation (QBO). Figure 2b shows the time-height cross section of the QBO. Large arrow indicates large wind speed, and vice versa. Westerlies and easterlies are represented by red and blue, respectively. Westerlies and easterlies initially appear at high altitudes, propagate downward with time, and then dissipate around 18 km altitude. The curve line shows time variation of easterlies and westerlies at 25 km. The "strength of QBO" refers to the strength of westerlies and easterlies (i.e., amplitude). The QBO exists in the area surrounded by the red dotted lines in Figure 1, where strong upwelling exists.
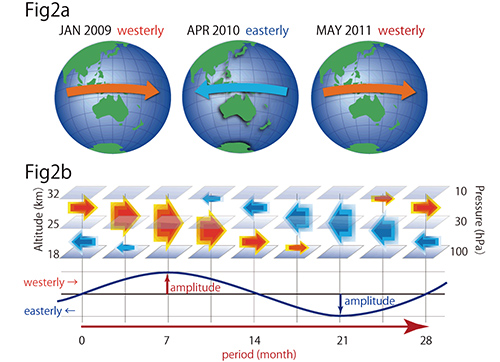
Figure 2. (a) Easterlies and westerlies at 25 km altitude. Red westerlies; Blue easterlies. From the left: January 2009 (westerlies), April 2010 (easterlies), May 2011 (westerlies). Easterlies and westerlies alternate in the equatorial stratosphere with a period of about 28 months. This phenomenon is called the Quasi-Biennial Oscillation (QBO). (b) Time-height cross section of the QBO. Large arrow indicates large wind speed, and vice versa. The curve line shows time-variation of the QBO at 25 km. The "strength of QBO" refers to the strength of westerlies and easterlies (i.e., amplitude).
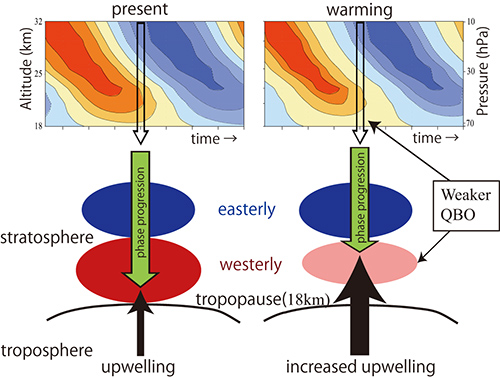
Figure 3. Schematic figures for the QBO in the (left) present and (right) warming climate. (Upper) The time-height cross section of the zonal wind. Red and blue colors correspond to westerly and easterly, respectively. (Lower) Stacked westerly (red) and easterly (blue) QBO phases (ovals) descending through the lower stratosphere, which has a mean meridional circulation (black arrows) with significant upwelling. Left and right panels represent the QBO in the present and warming climate, respectively. The QBO amplitude at the lowermost stratospheric levels decreases due to stronger tropical mean upwelling in a warming climate.
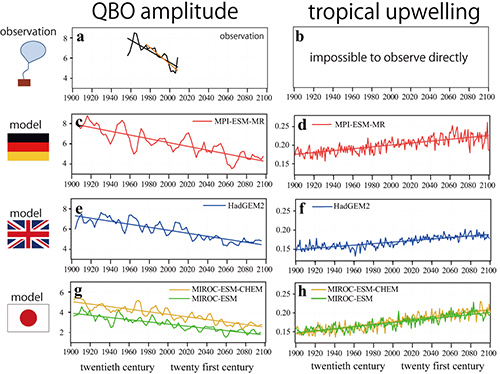
Figure 4. Changes at altitude of about 19 km in (left) QBO and (right) equatorial upwelling. (a,b) are monitoring data; (c,d), (e,f), and (g,h) are German, British, and Japanese modeling results, respectively. The larger the value of the vertical axis, the larger the speed of westerly and easterly winds that accompany QBO (left) as well as the upwelling (right). From the 20th to 21st century, the QBO has weakened and the equatorial upwelling strengthened.
Contacts:
Japan Agency for Marine-Earth Science and Technology (JAMSTEC)
- (For the study)
-
Yoshio Kawatani, Senior Scientist
Research Institute for Global Change (RIGC), Global Change Projection Research Program, Global Change Analysis Research Team - (For publication)
-
Kazushige Kikuchi, Director
Planning Department Press Office
E-mail: press@jamstec.go.jp