Press Releases
May 29, 2013
JAMSTEC
Yamaguchi University
Kochi University
University of Southern Denmark
Scottish Association for Marine Science
Environmental Disturbance of Japan Trench Seafloor 4 Months after Earthquake
—Analysis of Radionuclide Behavior Associated with Nuclear Accident—
1. Overview
Technical Scientist Kazumasa Oguri and others of the Japan Agency for Marine-Earth Science and Technology (JAMSTEC: Asahiko Taira, President) Institute of Biogeosciences and colleagues from organizations including Yamaguchi University, Kochi University, University of Southern Denmark, and The Scottish Association for Marine Science collaborated to take Hi-definition TeleVision (HDTV) videos in the water column and on the seafloor by using the Free Fall Camera System developed by JAMSTEC. They also collected sediment cores 4 months after the Tohoku Earthquake in July 2011 at the Japan Trench axis (depth 7553 m, hereinafter referred to as trench axis) 110 km from the hypocenter and at a point 4.9 km east of this trench axis on the Pacific Ocean side (7261 m, hereinafter Pacific Ocean side).
The results of image processing from the obtained images show that for both study sites, there was a 30 to 50 m thick layer of extremely high turbidity above the seafloor. On the seafloor of the trench axis, hardly any living benthic organisms were seen. In addition, the existence of a strong and persistent downslope current on the seafloor was confirmed, and fish as well as the remains of organisms were being transported towards greater depths. Thus, the seafloor environment was found to be in a state very different from that reported previously, such as holothuria are seen. On the Pacific Ocean side seafloor, the type of strong flow observed in the trench axis did not exist, and swimming organisms including amphipods were observed.
The sediment samples collected from both the trench axis and Pacific Ocean side were analyzed by an X-ray CT scanner and for radionuclides by using a gamma-ray spectrometer. The results of X-ray CT scanner analysis showed that layers of so-called turbidites (*1), thought to result from the transport and redeposition of slope sediments due to turbidity currents caused by the main shock and aftershocks, were present down to a depth of 31 cm in surface sediments collected from the trench axis. In contrast, turbidites were not observed in the sediments from the Pacific Ocean side.
The sediment radionuclide results from the gamma-ray spectrometer revealed Cesium 134 from the Fukushima Daiichi Nuclear Power Plant accident (hereinafter nuclear accident) in the surface layers (0 to 1 cm depth) of sediments collected on the Pacific Ocean side. However, Cesium 134 was not detected in sediments collected from the trench axis.
One explanation for the detection of Cesium 134 in the seafloor of the Japan Trench several months after the nuclear accident is that the radionuclides adsorbed to marine snow (*2) and sank. As supporting evidence, satellite remote sensing confirmed that there was a large phytoplankton bloomimg after the earthquake from late March to early April in the Japan Trench area. In addition, the results of seafloor observations with Deep Tow during an emergency cruise (June) conducted prior to this research cruise confirmed that aggregations of marine snow, which had presumably been produced and deposited during this period, covered the seafloor of the Japan Trench slope.
The non-detection of Cesium 134 in the trench axis only 4.9 km from the Pacific Ocean side is judged to have been caused by turbidity currents, which occurred after the Cesium 134 was deposited on the seafloor, mixing the radionuclide with the surface sediments and diluting the concentration to below the detection limit. This suggests that the slopes of the Japan Trench are in a gravitationally unstable state in which turbidity currents are prone to occur because of the main shock and repeated aftershocks, and that the aftershocks maintained the perturbation of the seafloor environment.
These findings are published in Scientific Reports (an online journal published by the Nature Publishing Group) on May 29 (Japan time). The paper is seen in the following URL: http://www.nature.com/srep/2013/130529/srep01915/full/srep01915.html.
*1 Turbidite: Formed by the transport and redeposition of slope sediments to deeper seafloor areas by turbidity currents occurring on slopes. During the flow of turbidity currents on slopes, particles are separated by size with sediments being formed by coarse particles being deposited first and smaller particles being deposited later.
*2 Marine snow: Aggregates of organic materials that fallout from seawater. These are formed from the remains of phytoplankton and other materials. They are so named because they looked like peacefully falling snow when observed from a submersible vessel.

Figure 1. Maps of study sites. The red star on the upper left map is the epicenter. The black lines are 1000-m interval isobaths. The bottom right map is an expansion of the red framed area in the upper left map and the black lines are 100-m interval isobaths. The distance from trench axis point to the Pacific Ocean side point is 4.9 km. Water depth increases as the color darkens from orange to purple.
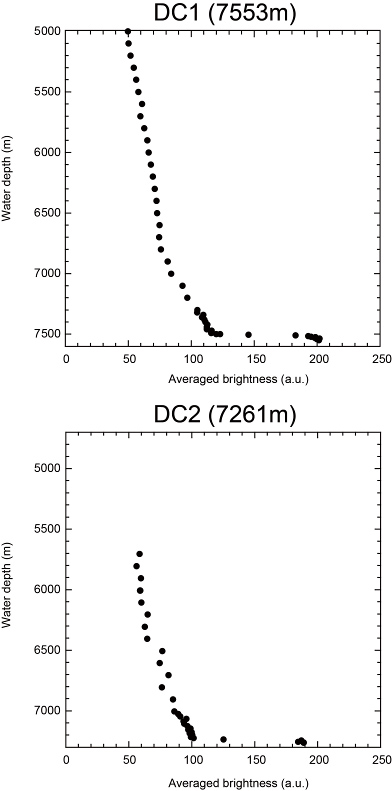
Figure 2. The brightness of images taken in the water column obtained from video recordings. This indirectly shows the turbidity because the image brightens when turbidity is high. Brightness is a qualitative arbitrary unit and not an absolute value; nonetheless, by plotting the brightness of the image against the depth, the thickness of the turbid zone can be estimated.
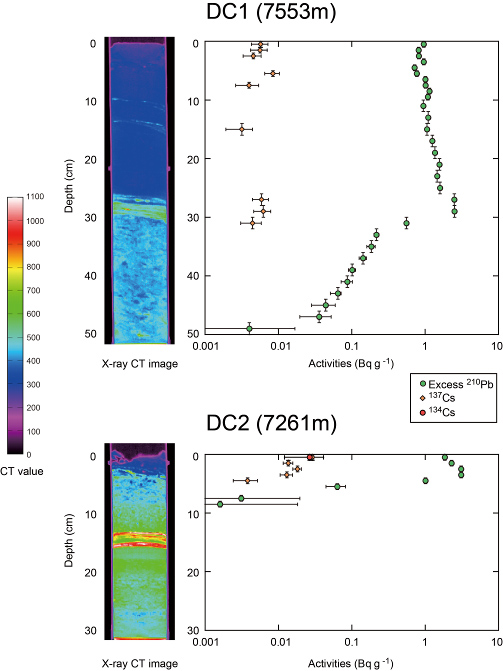
Figure 3. X-ray CT image of sediment core and radionuclide concentrations. The higher the CT value, the denser the sediments.The sediments at the trench axis from 0 to 31 cm depth are composed of thin high-density layers and thicker low-density layers stacked upon one another. Volcanic glass is the principal constituent of the high-density layer at the Pacific Ocean side at a depth of 13 to 15 cm; this layer is unrelataed to the current earthquake. The measured radionuclides were Lead 210, Cesium 137, and Cesium 134. The Excess 210Pb noted in the legend indicates the Lead 210 from the atmosphere and seawater that reaches the seafloor.
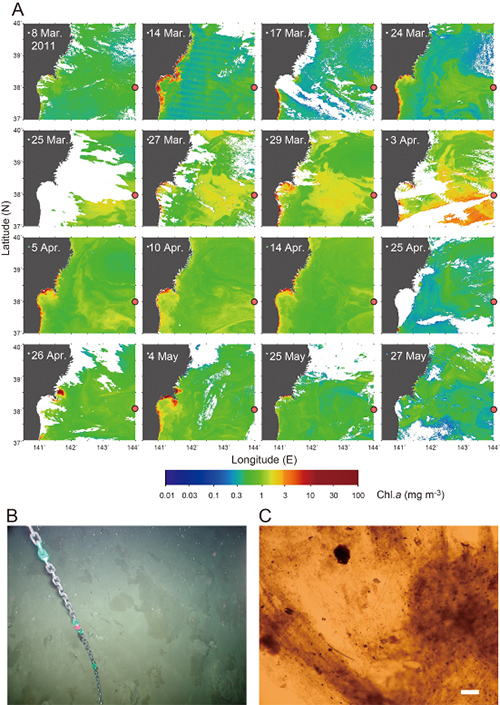
Figure 4. (A) The distribution of chlorophyll a and its time-dependent changes obtained from remote sensing by the NASA Aqua satellite. Large-scale phytoplankton bloom (inside black rings) occurred from March 25 to April 3. The red dot in the figures indicates the area that includes the two study points. Satellite data were provided courtesy of NASA, JAXA Earth Observation Research Center, and Tokai Unversity Research & Information Center.
(B) Images taken by the Deep Tow camera during the June 2011 Emergency Cruise (YK11-E04, Leg1) of the Japan Trench slope at a depth of 5800 m. The olive-colored mats indicated by the white arrows are composed of phytodetritus aggregations. (C) Photomicrograph of phytodetritus collected by dredge sampling. The material is mainly composed of diatom shells. The white line represents 100μm.
Contacts:
Japan Agency for Marine-Earth Science and Technology (JAMSTEC)
- (For the study)
-
Kazumasa Oguri, Technical Scientist
Institute of Biogeosciences (BioGeos), Earth and Life History Research Program, Geobiology Research Team
Marine Technology and Engineering Center (MARITEC), Advanced Marine Technology Research Program, Marine Basic Technology R&D Group
Email: ogurik@jamstec.go.jp - (For publication)
-
Kazushige Kikuchi, Director
Planning Department Press Office
E-mail: press@jamstec.go.jp