Press Releases
May 20, 2016
JAMSTEC
Miyagi-ken-Oki Earthquake May Occur within Shorter Time Interval
- Suggested by successful reproduction of the 2011 Tohoku-Oki earthquake characteristics -
Overview
A research group led by Dr. Ryoko Nakata at Research and Development (R & D) Center for Earthquake and Tsunami (CEAT), the Japan Agency for Marine-Earth Science and Technology (JAMSTEC: Asahiko Taira, President) conducted numerical simulations of earthquake generation cycles prior to, during and following the 2011 M9 Tohoku-Oki Earthquake using realistic three-dimensional (3D) geometry of the subducting Pacific Plate. In 121 scenarios, the time interval between the M9 class earthquake and the subsequent M7 class earthquake off Miyagi Prefecture (Miyagi-ken-Oki earthquake) was equal to or shorter than the average recurrence interval during the later stage of the M9 class earthquake cycle. The scenarios successfully demonstrated reproduction of important characteristics such as the recurrence of M7 class earthquakes, coseismic slip distribution, afterslip distribution, the largest foreshock, and the largest aftershock of the 2011 earthquake. These results should help investigate possible scenarios for occurrence of M7 class earthquakes and contribute to disaster prevention and mitigation of earthquakes.
This work was supported partly by the project “Research project for compound disaster mitigation on the great earthquakes and tsunamis around the Nankai trough region” of the Ministry of Education, Culture, Sports, Science and Technology of Japan. JAMSTEC's Earth Simulator was used for all simulations.
The above results were published on Scientific Reports on May 10, 2016 (JST).
Title: Possible scenarios for occurrence of M~7 interplate earthquakes prior to and following the 2011 Tohoku-Oki earthquake based on numerical simulation
Authors: Ryoko Nakata1, Takane Horii, Mamoru Hyodo1, Keisuke Ariyoshi1
1. JAMSTEC
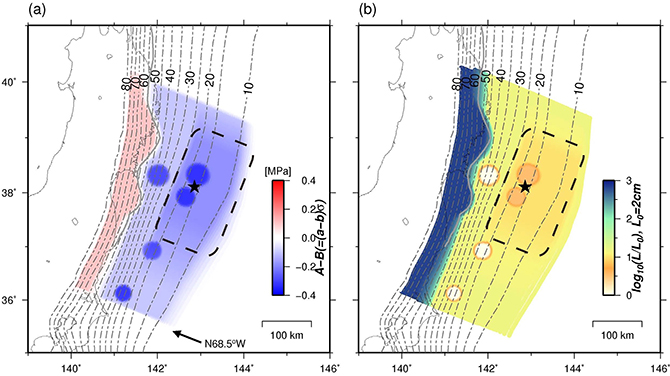
Figure 1. Distribution of frictional parameters. (a) Spatial distribution of (A-B) (MPa). The parameter A controls the slip increase rate at which the stress reaches the strength. The parameter B controls strength recovery. Unstable slip is expected to occur when A-B < 0.The dashed-line rectangle indicates the frictional heterogeneity area for the M9 class earthquake assumed in this model. Contours indicate depth (km) to the upper surface of the descending plate. The black star shows the hypocenter of the 2011 Tohoku-Oki earthquake. (b) Characteristic slip distance.
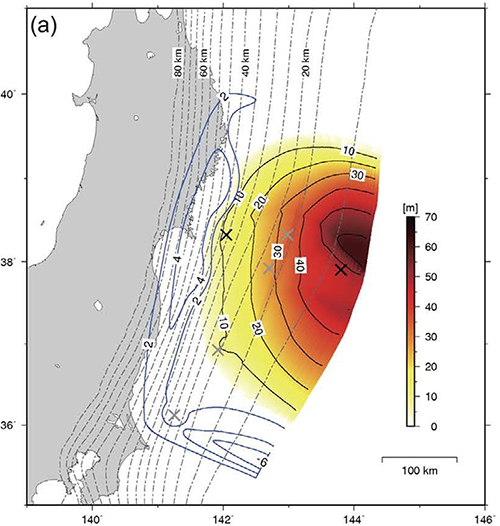
Figure 2. Coseismic slip distribution of the M9.1 earthquake (shown in warm colours) and afterslip over three years since the occurrence of the earthquake (shown in blue lines).
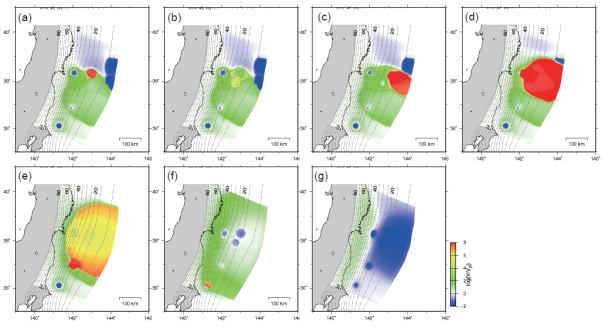
Figure 3. Slip velocity distribution prior to, during and following the M9.1 earthquake obtained by numerical simulations. Blue and red areas indicate locked parts of the fault and unstably slipping parts of the fault, respectively. Yellow/green and white indicate slow slip and plate convergence rates, respectively. (a) Occurrence of the M7.4 earthquake (foreshock) in the red area 13 days prior to the M9.1 earthquake. (b) 12 days prior to the M9.1 earthquake when afterslip due to the foreshock (shown in yellow green) propagated toward the south. (c) Initiation of the M9.1 earthquake. (d) Coseismic rupture of the M9.1 earthquake propagated off Miyagi Prefecture. (e) Coseismic rupture of the M9.1 earthquake propagated off Fukushima Prefecture. (f) Occurrence of the largest aftershock (M7.0) of the M9.1 earthquake off Ibaraki Prefecture. (g) 3.5 years after the M9.1 earthquake.
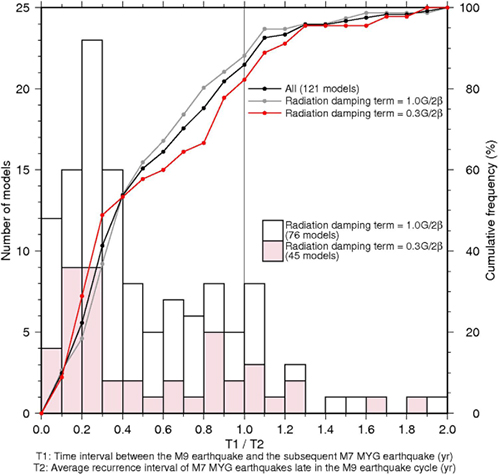
Figure 4. Distribution of the ratio of T1 and T2. T1 is the time interval between the M9 class earthquake and the subsequent M7 class earthquake off Miyagi Prefecture. T2 is the average recurrence interval of the M7 class earthquakes late in the M9 class earthquake cycle. The red bars with the left vertical axis and the red polygonal line with the right vertical axis represent the number and cumulative frequency (%) of the simulations using a small value of radiation damping term (η = 0.3G/2β) to reproduce a shorter duration during the M9 class earthquake. The open bars and the gray polygonal line show the results using a large value of radiation damping term (η = 1.0G/2β). The black polygonal line show the results from both red and open bars. The average recurrence interval of M7 class earthquakes off Miyagi Prefecture were calculated during 200 years before the M9 class earthquake.
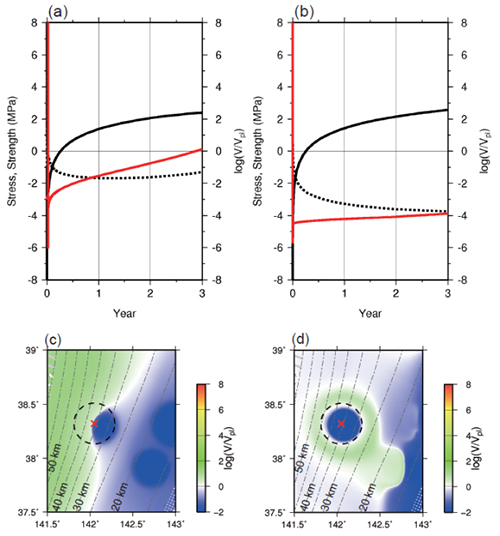
Figure 5. (a) Strength (solid black line), slip velocity (dotted black line), and stress (solid red line) over a three-year period immediately following the M9.1 earthquake. (b) Strength, slip, velocity, and stress over a three-year period following the M7.3 earthquake off Miyagi Prefecture. (c) The slip velocity distribution after one year of the M9.1 earthquake as shown in a). The green area indicates afterslip while the blue locked. The red cross indicates the point shown in a). (d) Slip velocity distribution after one year of the M7.3 earthquake off Miyagi Prefecture as shown in b).
Contacts:
- (For this study)
- JAMSTEC
- Ryoko Nakata, Project Research Scientist, Research and Development (R & D) Center for Earthquake and Tsunami (CEAT)
- Takane Hori, Group Leader, Research and Development (R & D) Center for Earthquake and Tsunami (CEAT)
- (For press release)
- Tsuyoshi Noguchi, Manager, Press Division, Public Relations