
Month-long Predictability of Madden-Julian Oscillation (MJO)
 Demonstrated on K Computer Using Highly Complex New-generation Global Model
Demonstrated that the Nonhydrostatic Icosahedral Atmospheric Model (NICAM) on the supercomputer K is effective for month-long forecasts of the Madden-Julian Oscillation (MJO), a huge eastward propagating atmospheric pulse that affects the entire globe.
In 2007, the research team had successfully reproduced an MJO event by using the Earth Simulator (as reported on December 11, 2007 “Realistic Simulation of Madden-Julian Oscillation (MJO) –Suggests the potential of high-accuracy seasonal prediction-”). The present study further shows that the MJO prediction by NICAM is feasible for nearly a month, based on evaluations of a series of 54 highly complex simulations operated on the K computer.
MJO significantly impacts the tropical rainfall, affects El Niño/La Niña events and monsoon circulations, and generates tropical cyclones. The research team anticipates that the high MJO prediction skill by NICAM revealed in this study will enable us to foresee atmospheric activity on a global-scale at an earlier stage, as well as improve accuracy in predicting seasonal forecasts and typhoons around Japan. Moreover, the dataset consisted of numerous samples of successful MJO simulations is expected to significantly contribute to elucidating the yet-to-be-defined MJO mechanism by providing self-contained and physically consistent data to support reliable but sporadic observations.
This study has been published on Nature Communications on May 7 (Japan time), highlighted as Special Feature.
This study has been published on Nature Communications on May 7 (Japan time), highlighted as Special Feature.
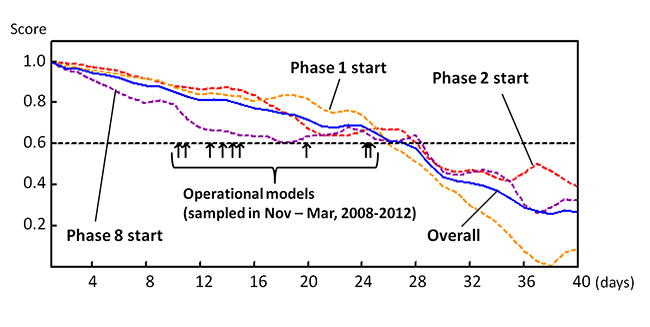
Figure 1: The Madden–Julian oscillation (MJO) skill scores of Nonhydrostatic Icosahedral Atmospheric Model (NICAM) plotted along the lead time from initial dates. Blue solid plot shows the overall skill score (bivariate correlation; COR) for all 54 simulations. Broken plots show COR for groups of simulations initialized at phase 8 (purple, 17 members), phase 1 (orange, 18 members) and phase 2 (red, 19 members). Arrows indicate the durations COR> 0.6 is maintained by recent operational models.
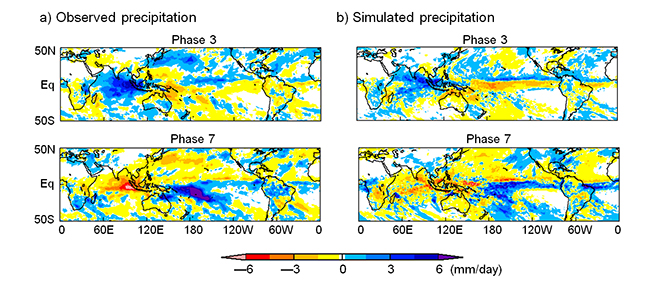
Figure 2: Precipitation anomaly composites for different Madden–Julian oscillation (MJO) phases. (a) One-Degree Daily product version 1.2 by the Global Precipitation Climatology Project, and (b) simulation. Average days from the initial dates of the simulations are 16 days (phase 3) and 28 days (phase 7). Resolution of the simulation output is lowered to 1°mesh to equal the resolution of the observational data set. Anomalies are calculated as deviations from 40-day mean values of each case.
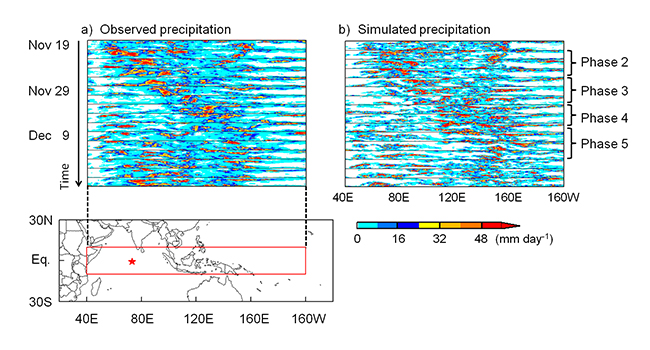
Figure 3: Two-daily series of cloud and rain over the tropical Indian to western Pacific Ocean. (a) Precipitation by the 3B42 product of the Tropical Rainfall Measuring Mission (TRMM) satellite28 and (b) precipitation by the simulation. The figures consist of slices that show horizontal snapshots of the tropical Indianto the western Pacific Ocean. The resolutions of the TRMM 3B42 data set and the simulated precipitation are lowered to 1° mesh. A red asterisk shows the observation point (Gan Island) indicated in Fig. 4.
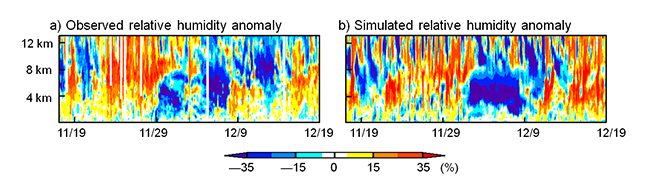
Figure 4: Time–height cross-sections of zonal wind and relative humidity anomalies.
Panel a) is relative humidity anomalies observed at Gan Island (73.2E, 0.7S, indicated in the Fig. 3 during the CINDY2011/DYNAMO field campaign. Panel b) is relative humidity anomalies from the corresponding grid point in the simulation.
Contacts:
Coupled Ocean-Atmosphere-Land Process Research, JAMSTEC
Dr. Tomoki Miyakawa( )
)
Atmosphere and Ocean Research Institute, the University of Tokyo
Dr. Masaki Satoh( )
)
Graduate School of Science, the University of Tokyo
Dr. Hiroaki Miura( )
)
RIKEN Advanced Institute for Computational Science
Hirofumi Tomita, Team Leader( )
)
⇒Press Release
Coupled Ocean-Atmosphere-Land Process Research, JAMSTEC
Dr. Tomoki Miyakawa(
)Atmosphere and Ocean Research Institute, the University of Tokyo
Dr. Masaki Satoh(
)Graduate School of Science, the University of Tokyo
Dr. Hiroaki Miura(
)RIKEN Advanced Institute for Computational Science
Hirofumi Tomita, Team Leader(
)⇒Press Release